

The wealthy aren’t paying their fair share, and that hurts programs and policies that help all Arkansans.
Our children have been back in school for weeks. Labor Day has passed. And we were teased with cooler weather last week. It feels like autumn is in the air.
At this point the start of the 2025 Regular Legislative session may seem far away. After all, we have an election on November 5 when we cast our votes for national, state, and local candidates. But Arkansas legislative committees are back at work, and the first bills will be filed in November.
Importantly, budget hearings will begin next month. While it might be tempting to wait to take notice of the 2025-27 Biennial Budget in January, many important decisions happen much earlier, starting with the Governor’s proposed budget, which will be discussed by our legislators in budget committee meetings. The state budget is public policy, as it reveals the priorities of our elected officials. But it should also consider the priorities of all Arkansans and fund the programs and services important to us.
We know the cumulative impact of 10 years of income tax cuts — mostly for the highest corporate and individual earners — has resulted in a reduction of more than $2 billion in general revenue annually. According to the latest Department of Finance and Administration projections for the current fiscal year, the expected surplus is only $280 million. While this may seem like a lot, it is in reality only about 3% of general revenue. In other words, we are already in a tight budget cycle, thanks to these tax giveaways.
Think of all the income earned in Arkansas as one big pie. Using analysis provided by the Institute on Taxation and Economic Policy, we can then assign “slices of pie” to groups of people according to how much income each of the groups earn:
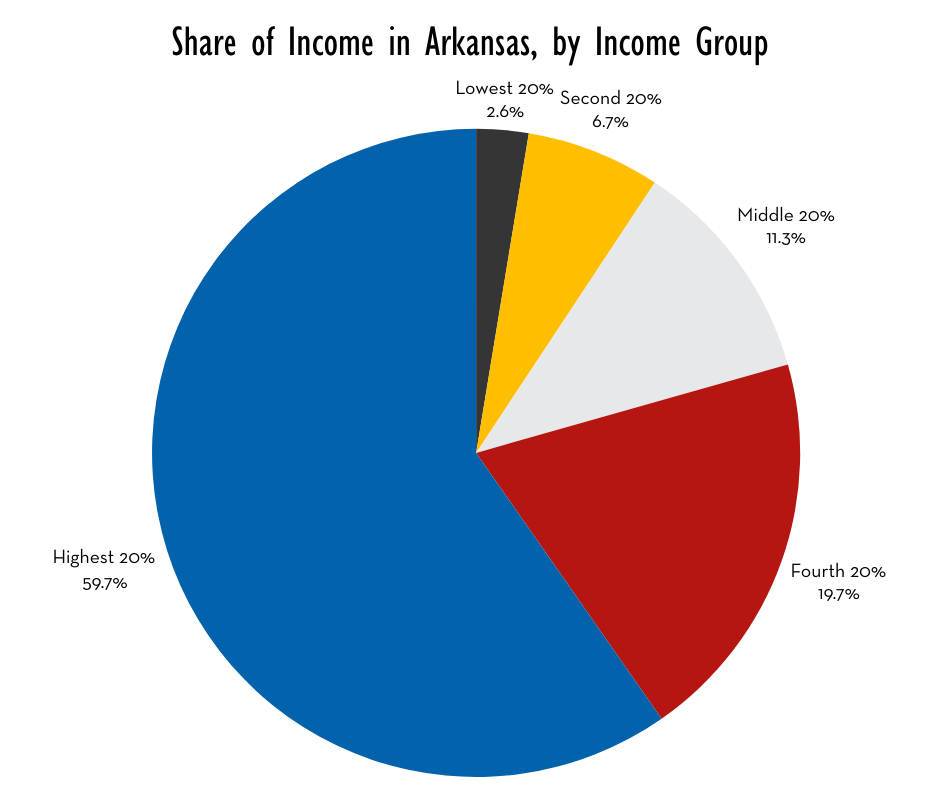
In our state, those in the lowest 20% (those making less than $17,800 a year), have a slice equal to 2.6% of the pie. While those in the highest 20% (those making at least $112,300), have a slice equal to 59.7% of the pie. This is similar to what we see in the United States overall, as we have witnessed a widening of the income gap in our country.
We can also think of taxes paid in our state as one big pie:
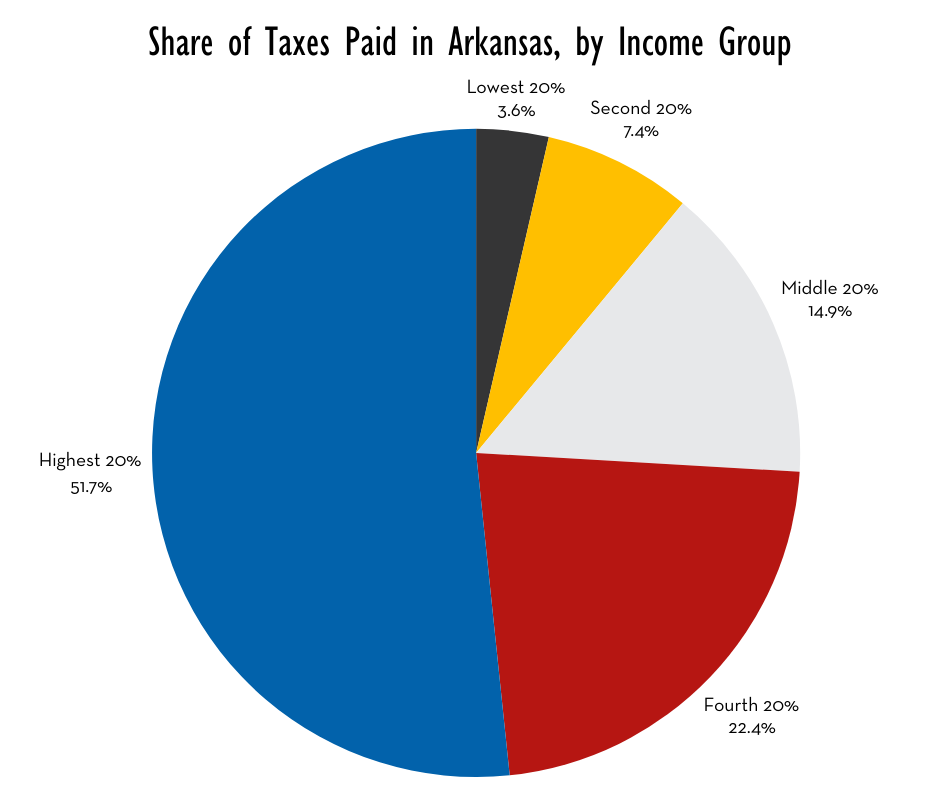
Perhaps as expected: as income increases, so too does share of taxes paid.
But it is when these two “pies” are compared with each other that an important story emerges. The inequity in the state tax structure is evident: The first four income groups have a higher share of paid taxes than earned income, while for the highest earners, the shares are reversed. Only the top 20% pay a lower share than they earn.
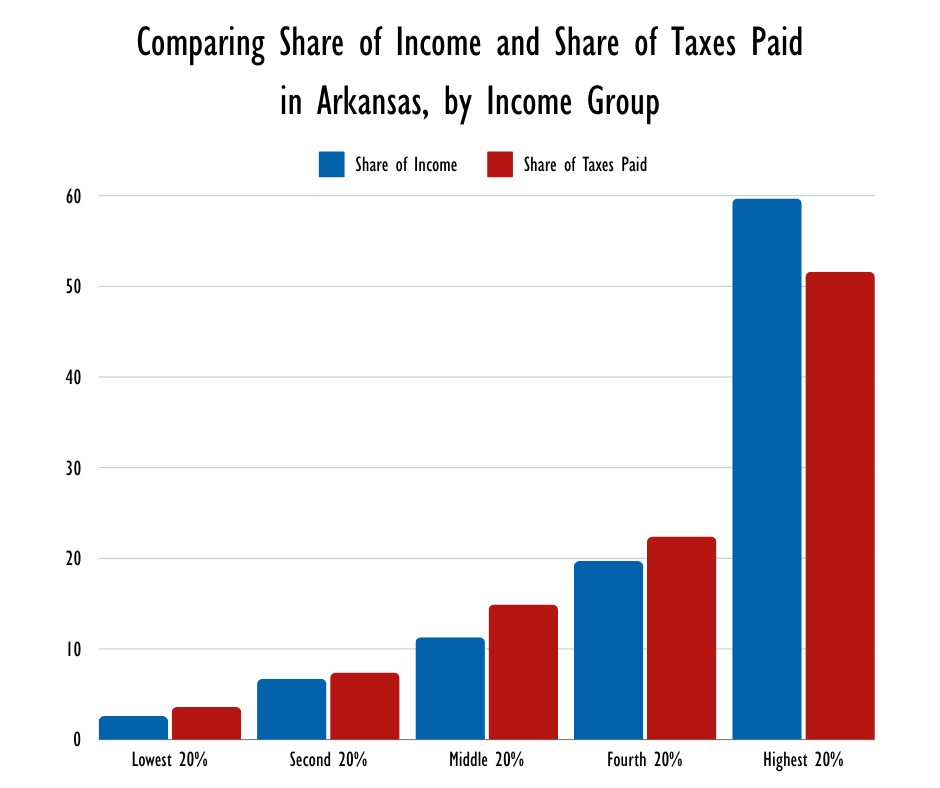
The data from these charts is presented in the table below. The table also breaks out the top 20% income group. And it shows the inequity is more evident with the highest 1% of earners. This group, making an average of $1,416,700 a year, has 19.3% of the overall income. But its share of the taxes they contribute is only 11.5%.
| Lowest 20% | Second 20% | Middle 20% | Fourth 20% | Next 15% | Next 4% | Top 1% | |
|---|---|---|---|---|---|---|---|
| Income Range | Less than $17,800 | $17,800 to $36,000 | $36,000 to $60,200 | $60,200 to $112,300 | $112,300 to $216,200 | $216,200 to $494,900 | More than $494,900 |
| Average Income for Group | $10,300 | $26,500 | $45,600 | $83,400 | $144,100 | $292,000 | $1,416,70 |
| Share of income | 2.6% | 6.7% | 11.3% | 19.7% | 25.6% | 14.7% | 19.3% |
| Share of state and local tax paid | 3.6% | 7.4% | 14.9% | 22.4% | 27.6% | 12.5% | 11.5% |
This upcoming legislative session, we don’t need additional income tax cuts that make our tax structure even more inequitable. Instead, we need investment in programs and policies that help all Arkansans thrive.